SQL

Generate Histogram Distribution

For a quick exploration of the distribution
In: SQL

Exporting the data to python is cumbersome... use SQL to generate a frequency distribution for a quick exploration.
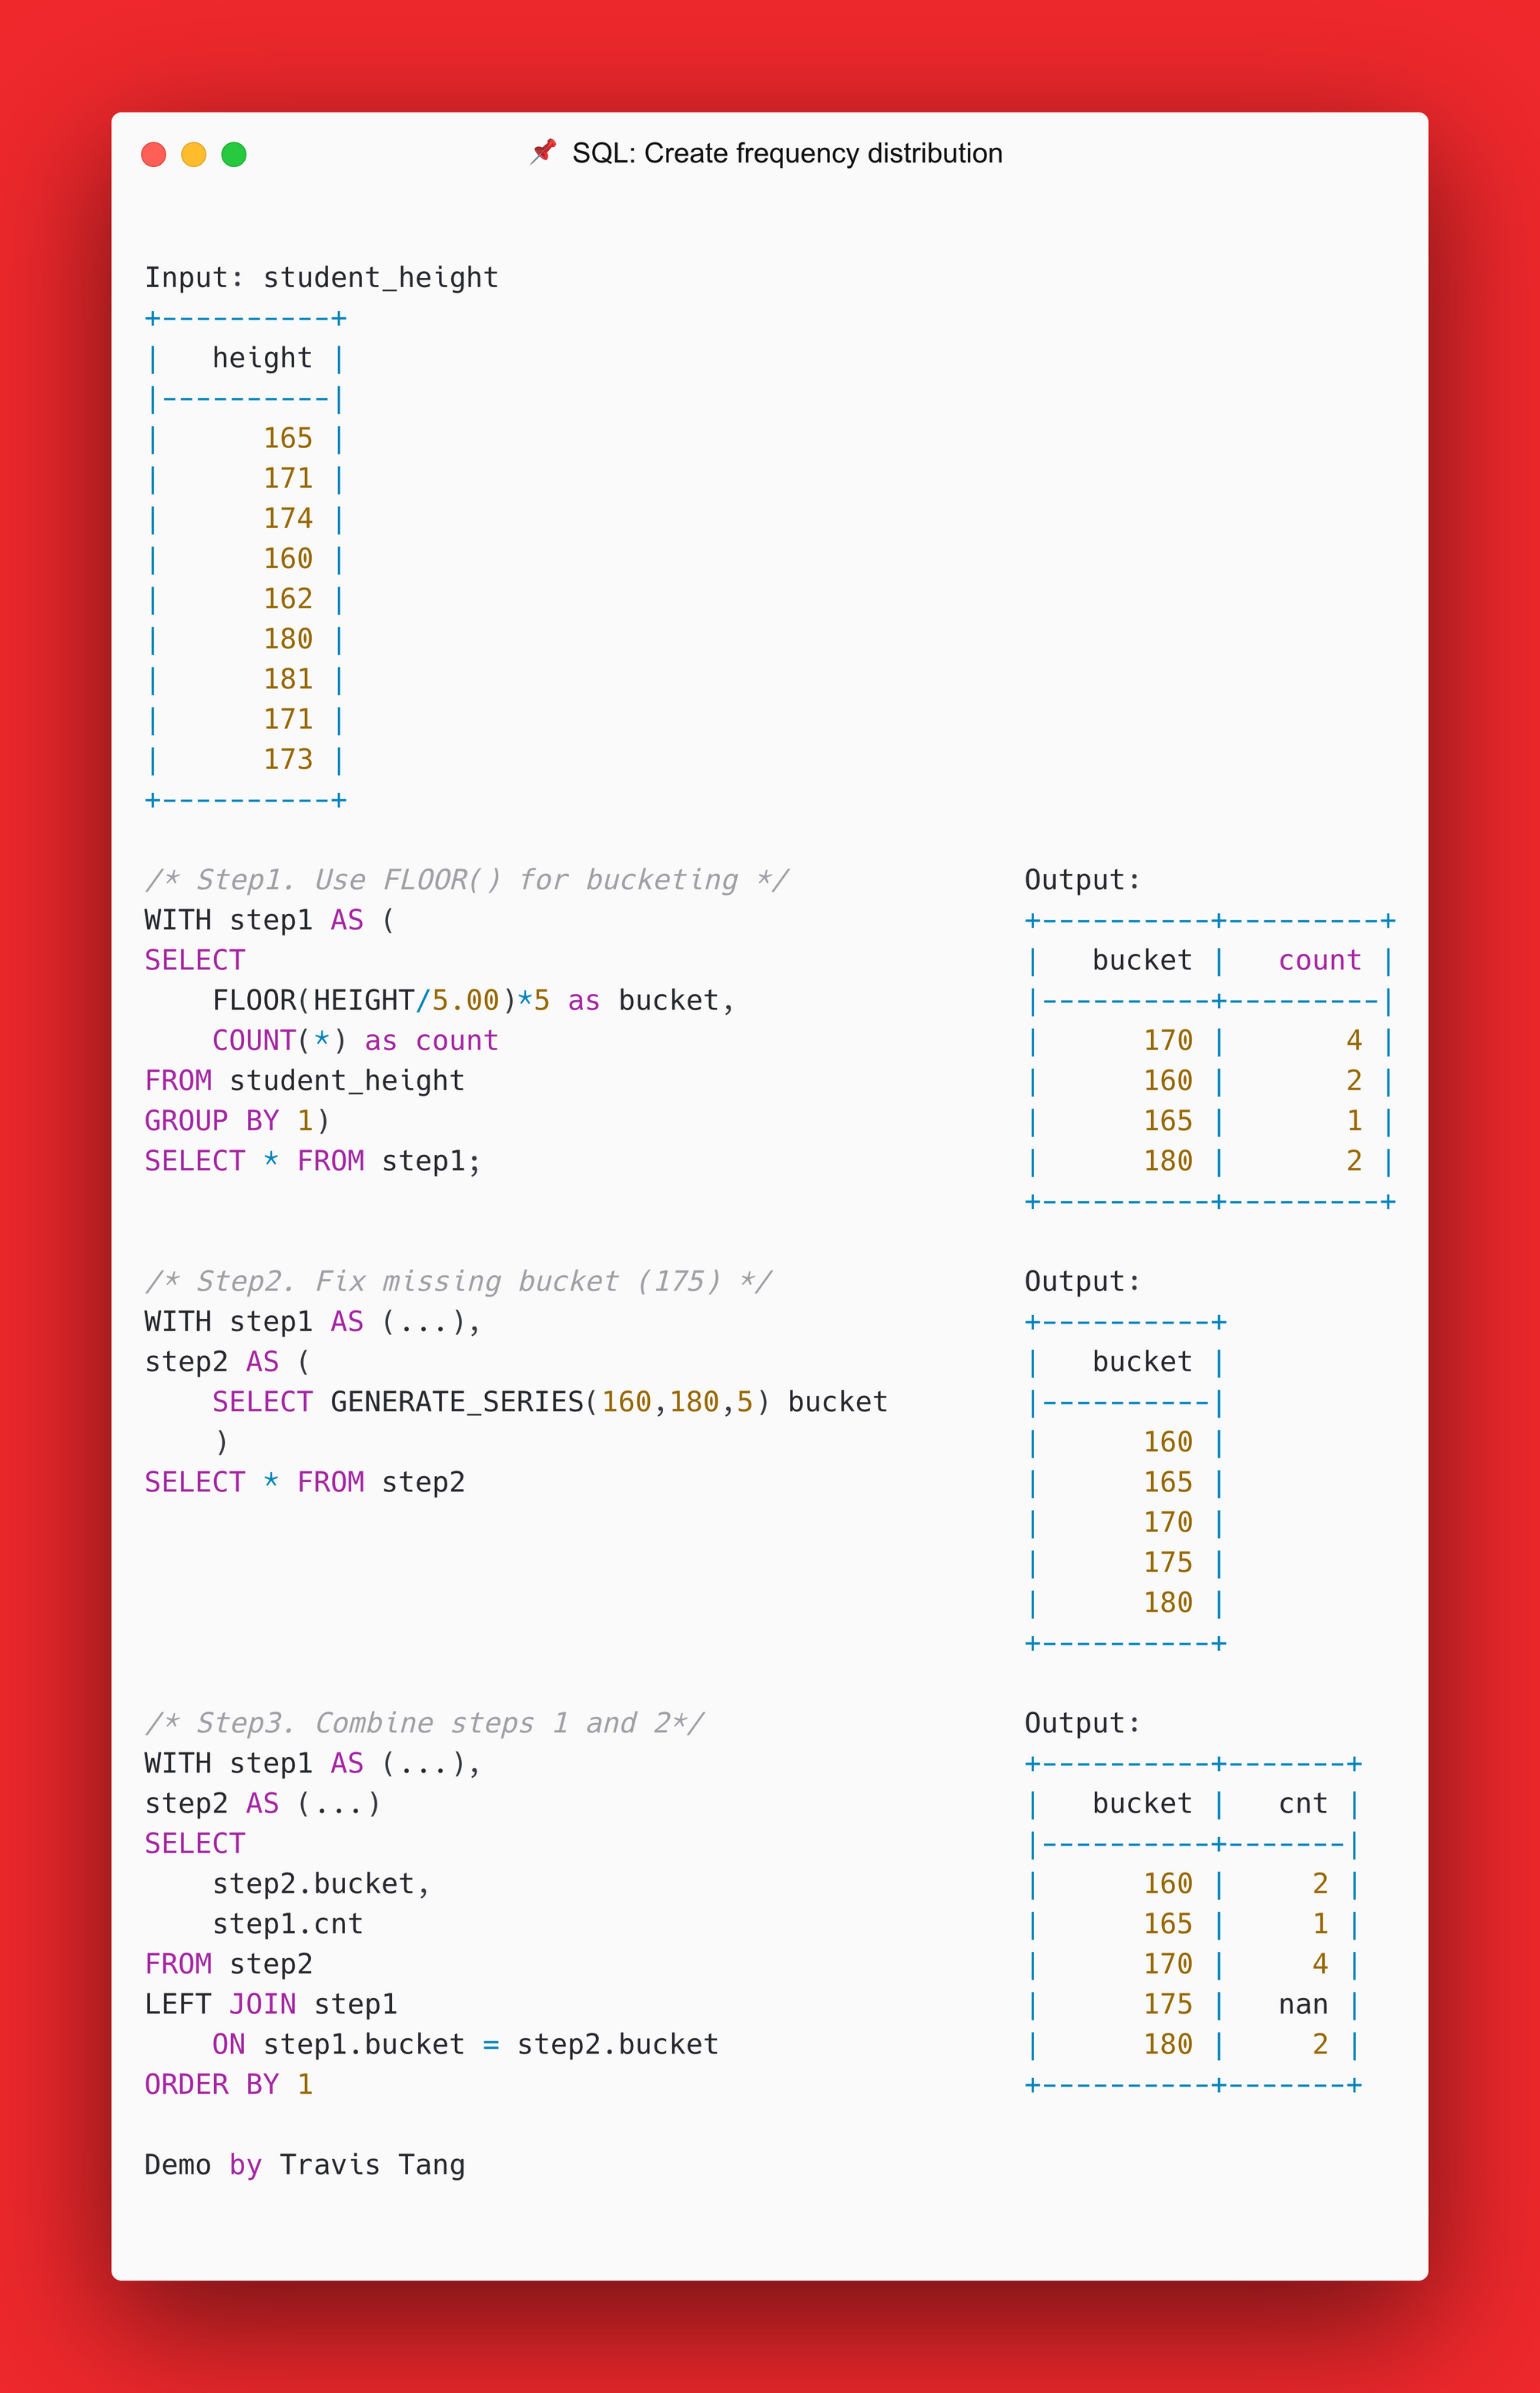
Here's how:
- Use π™΅π™»π™Ύπ™Ύπš to assign to buckets
- Fix missing bucket with π™Άπ™΄π™½π™΄πšπ™°πšƒπ™΄_πš‚π™΄πšπ™Έπ™΄πš‚
- Combine steps 1 and 2

Some caveats:
- Here, bucketing is done manually in a rather hacky way. Python's auto-bucketing is superior here.
- π™Άπ™΄π™½π™΄πšπ™°πšƒπ™΄_πš‚π™΄πšπ™Έπ™΄πš‚ is a PostgreSQL function. Its equivalent is also available in t-SQL, Redshift and Bigquery.
- Some dashboarding tools (Metabase) have built-in histogram visualization. You can use that instead if it's supported.

More from Travis Tang
Use ARRAY_AGG to flatten columns to lists.
SQL

Use ARRAY_AGG to flatten columns to lists.

You need to convert a long table of values into a list? This is the most convenient function. πŸ“Œ Syntax: πš‚π™΄π™»π™΄π™²πšƒ π™°πšπšπ™°πšˆ_𝙰𝙢𝙢(πšŒπš˜πš•πšžπš–πš—) π™΅πšπ™Ύπ™Ό πšπšŠπš‹πš•πšŽ There
Pivot Table (From Long to Wide)
SQL

Pivot Table (From Long to Wide)

Every data scientist, scientist, and engineer should know how to create a pivot table. π™²π™°πš‚π™΄ πš†π™·π™΄π™½ is the best way to do
Find duplicates with RANK
SQL

Find duplicates with RANK

Let's clean out duplicates! Here's how. 1️⃣ Check if duplicates exists. Use π™Άπšπ™Ύπš„π™Ώ π™±πšˆ + π™²π™Ύπš„π™½πšƒ(*) to find duplicates. See example 1 in image
Great! You’ve successfully signed up.
Welcome back! You've successfully signed in.
You've successfully subscribed to Travis Tang.
Your link has expired.
Success! Check your email for magic link to sign-in.
Success! Your billing info has been updated.
Your billing was not updated.