3 On-the-Job Tips for Data Analysts
Simple steps for better analytics


You took all the classes needed to become a data analyst. SQL? Check. Python? Check. You recently became a data analyst, or you are an aspiring analyst.
No doubt, your technical skills will bring you far in the role, but how can you become an even stronger analyst?
A year ago, I graduated as a chemical engineer and landed the role of a data analyst in a tech company. I didn’t know what to expect for my first role in data analytics.
Here are some tips that I wish I knew before I became a data analyst, so you don’t have to learn them the hard way.
As a data analyst, I answer questions from business teams with data insights. It almost sounds trivial — data analysts simply answer questions, right?
Not quite. The devil lies in the detail.
The way that an analyst answers the question dictates the quality of the analytics.
That’s why my three tips are to
- Know the question type — and answer appropriately.
- Know the question’s intent — and don’t become a query monkey.
- Tell data stories.
Before I get into them, I will first summarize what an analyst does.
The role of an analyst
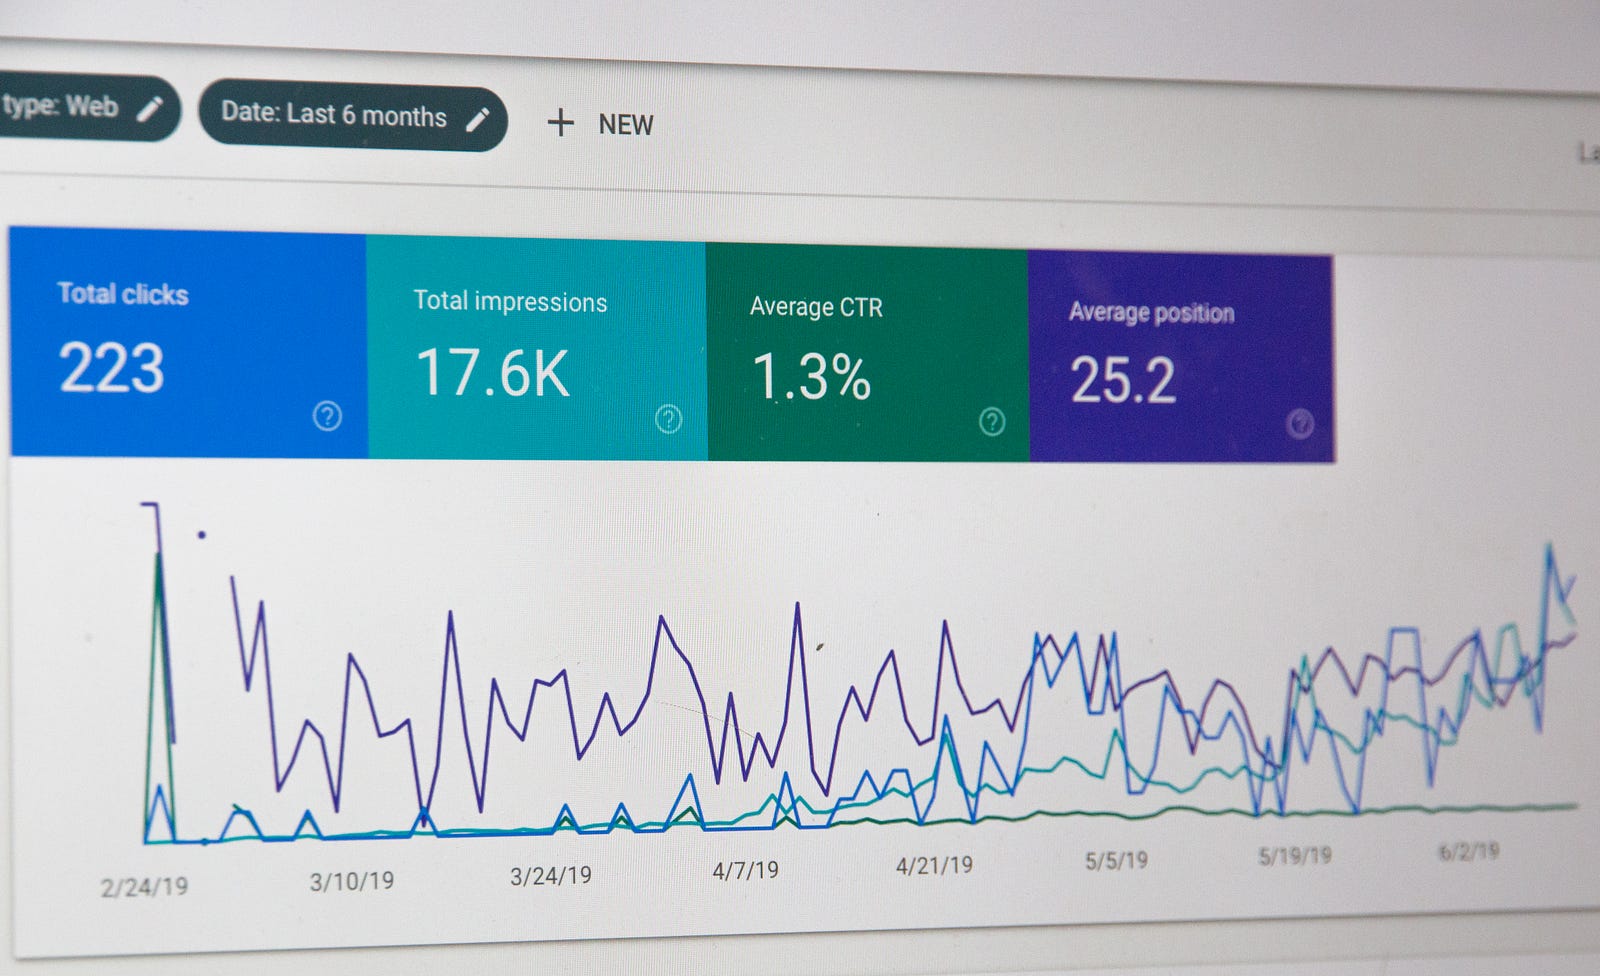
Often, the data insights are best communicated through numbers or charts. To achieve that, I use these tools from my toolbox.
- SQL for data extraction from the Cloud (my company use BigQuery and PostgreSQL)
- Tableau, Google Data Studio, and Metabase are business intelligence (BI) dashboard tools for stakeholders to interact with.
- Python and R for data wrangling and visualization, especially if certain packages are needed.
- Google Sheets and Excel are essential for presenting small datasets.
Here’s an example workflow.
- Business stakeholder reaches out to the analyst on a question that can be answered with data.
- The data analyst works with the stakeholder to understand the stakeholder’s intent.
- The analyst provides insights and recommendations with data — with proper data storytelling skills.
- Rinse and repeat.
Now, with that out of the way, here are my tips for aspiring and new data analysts while you’re on the job.
1. Know the question type — and answer appropriately.

The questions that an analyst answers can come from different teams (sales, product, marketing, operations, strategy, or engineering). These questions can be broken down into six different types.
Descriptive
- e.g. Who are our most active users?
- Calls for short, quick answers.
Exploratory
- e.g. Why are certain users no longer active?
- Calls for the exploration of multiple hypotheses that are probable.
Inferential
- e.g. Is the decrease in active users a result of Covid?
- Calls for a deep-dive into one hypothesis and finding correlations between different datasets.
Predictive
- e.g. Which customer will become active in the future?
- Calls for the use of predictive models, potentially in the form of regression.
Causal
- e.g. Does the introduction of in-app rewards cause more users to become active?
- Calls for the use of statistically significant experiments (think chi-squared test) on a sample of users.
Mechanistic
- e.g. How do in-app rewards cause more users to become active?
- Calls for the exploration and linking of multiple related datasets.
Knowing what type of question you are answering provides a framework for answering the question.
For more details, read the free book “Art of Data Science” by Roger D. Peng and Elizabeth Matsui. It’s a relatively quick read that I recommend.
2. Know the question’s intent — and don’t become a query monkey.
A query monkey extracts data extraction upon request without asking what question does the data answer. Often, the intention of the data request is hidden from sight, uncovered only with some probing. That’s why I like to think of data requests like an iceberg.

You’d be surprised — sometimes the data requester might not even know why they really need the data.
That’s why an understanding of the intention helps the analyst answer the requester’s questions better. Before I start a data extraction or exploration, I ensure that I understand the following 5W1H’s
5W1H’s of the data
- Who is the end-user of this data?
- What is the impact of this work?
- When is the relevant period?
- Where can I get the data from?
- Why do we need this?
- How will the data analysis be used?
This sheds more light on what data set we need to use to answer what questions. I have gone into more detail about how we can understand the intent of a data request here:

Tell data stories
Data storytelling is the art of using a narrative structure to communicate data insights. Without proper data storytelling, unnecessary details and data can easily drown out key insights.
“progressive reveals”. Suggested Tableau
Imagine the process:
- First, explain what the axes are.
- Next, show one sample data point.
- Then, reveal more data points.
- Use colours to show the differences in data points.
- Add animation to show changes over time.
My favourite example of this technique is definitely Hans Rosling’s 200 Countries, 200 Years, 4 Minutes. Here, Rosling builds his data story one element at a time, engaging the audience along the way.
For more data storytelling tips, I definitely recommend
To learn data storytelling, here are some resources I recommend:
- Datacamp’s Data Storytelling with R’s tidyverse.
- Cole Knafflic’s Storytelling with Data.
Closing
Knowing these tips in theory is different from practicing them in your day-to-day work. Having incorporated them into my work, I found that I am able to better answer the questions of the end-users, and they also understood my analytics better.
I regularly post content on here and LinkedIn. Follow me for more content like this!