90% Effective COVID-19 Vaccine Explained
Analyzing and Questioning Pfizer's Data with Data Science


When Pfizer and BioNTech announced that its mRNA vaccine was more than 90% efficacious, the world erupted with joy. The groundbreaking news is a ray of hope that things are on the verge of returning to normalcy. However, the data skeptic in me instinctively quizzed —
What does an efficacy of 90% actually mean?
What tests were done to arrive at the efficacy value of 90%?
Does this mean that this COVID vaccine will work for me?
To answer these questions in this post, I will…
- Explain why the Pfizer and BioNTech vaccine has >90% efficacy
- Outline the four steps to find the vaccine’s efficacy in a randomized controlled trial
- Run a chi-squared test to establish if the vaccine is in fact efficacious
- Tell you why you should not trust this analysis
What does ‘efficacy’ really mean? How do we test for a vaccine’s efficacy?
Put simply, efficacy is the effect of treatment under controlled lab experiments. This is different from effectiveness, which is its effect in real-world circumstances.
A randomized controlled trial (RCT) is ideal to test for a drug’s efficacy. This is very similar to what data scientists know as A/B Testing with some exceptions in the terminologies. In an RCT, a population of subjects is selected. They are then randomly split into two groups, the treatment and control groups which receive the vaccine and a placebo drug respectively.
The chart below simplifies how a generic COVID-19 vaccine randomized controlled trial is run. [1]
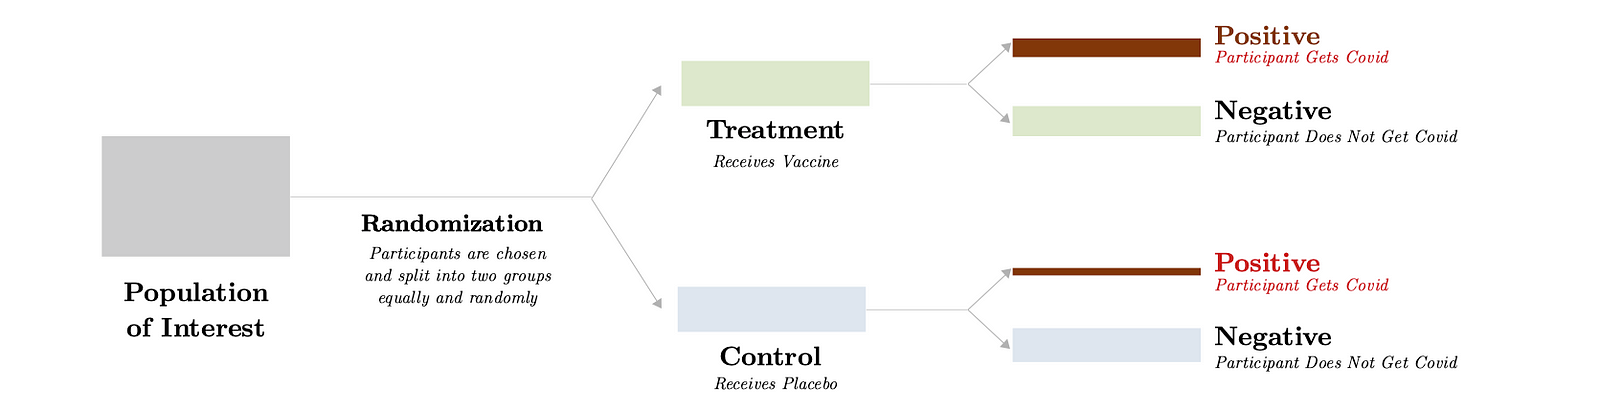
We can break down the diagram above into 4 smaller steps.
1. Identify the population of interest
This population of interest is selected based on a series of criteria, making them clearly defined and homogenous. For instance, the population of interest may be those above 70-year-olds with no prior clinical records if the drug is aimed at healthy elderly. (Unfortunately, the population of the BNT162b2 vaccine RCT is not explicitly stated.)
2. Randomization
Next, the researchers use randomization techniques to select potential participants from the population of interest. Some randomization techniques include simple random sampling, block sampling and stratified random sampling. If a simple random sampling method is used, the researchers can look at the comprehensive and exhaustive list of 70-year-olds with no prior clinical records, assign a random number to each individual in the list, and select the individuals with a number less than a threshold.
For instance, if the research is looking to enrol 50,000 participants in the study out of a 1,000,000 people in the list (i.e. 5% out of the population of interest), the researchers can assign a random number from 0 to 1 to each individual. Only those with numbers smaller than 0.05 are selected to participate in the study.
3. Separation into Treatment and Control Groups
This group of participants are then separated into the treatment and control groups. Simultaneously, the treatment group receives dosages of the COVID-19 vaccine while the control group receives the placebo vaccine in the same dosage amounts.
4. Collecting Samples
Now, the researchers wait until enough participants contract COVID-19. This is necessary to obtain the minimum sample size required for statistically significant analysis. In the case of Pfizer-BioNTech mRNA-based vaccine, it was decided that there needs to be a minimum of 62 COVID-19 positive cases before the first interim analysis can be conducted based on discussion between the companies and FDA according to the press release.
Okay, now I understand the procedure. But how was the efficacy of 90% calculated?
According to the official press release by Pfizer [2],
- The study enrolled 43,538 participants
- The analysis evaluated 94 confirmed cases of COVID-19 in trial participants
- The vaccine candidate was found to be more than 90% effective in preventing COVID-19 in participants
Now, let’s visualize these numbers using the figure below.
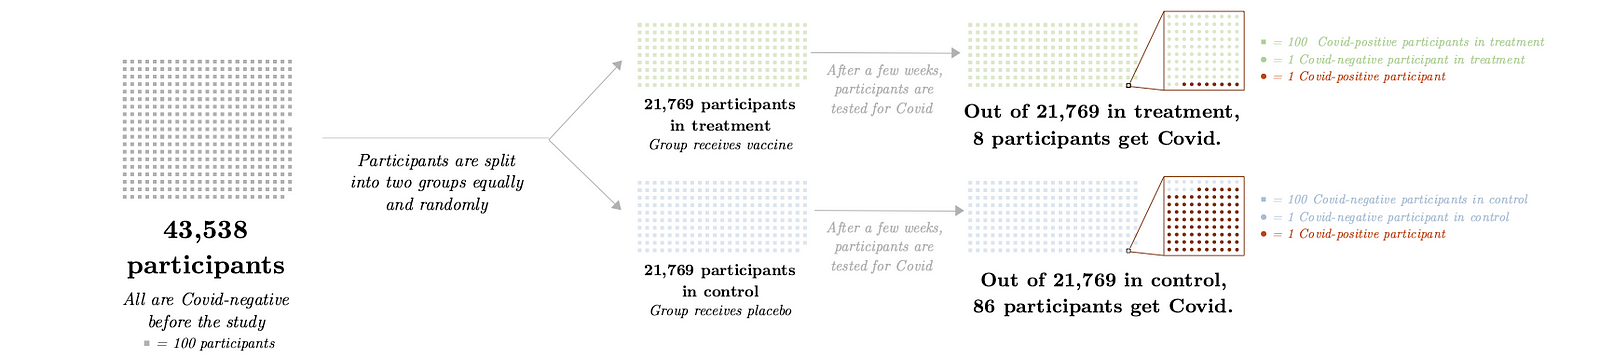
In the figure, we see that 43,538 COVID-negative participants participated in the study. They were then split equally into the control and treatment groups (each with 21,769 participants) and given the vaccine or placebo drug respectively. After a few weeks, the participants were tested again for COVID-19. The number of participants who contracted COVID-19 in the control group is 86 while that in the treatment group is 8 according to a Cambridge professor of risk and statistics. [3]
These numbers inform us that the efficacy of the mRNA vaccine by Pfizer and BioNTech is around 93%, as calculated below.
How confident are we about the efficacy of the drug?
This is a long section on conducting a chi-squared test of independence. This section can be skipped without a loss in continuity.
Even under highly-controlled experiments, the presence of noise and error cannot be eliminated. The less noise there is, the more confident we are of the efficacy of the randomized trial.
Statistical tests are run to determine the amount of noise present in the experiment. Now, let’s run through the steps of running a statistical test for the Pfizer-BioNTech mRNA Vaccine Trial.
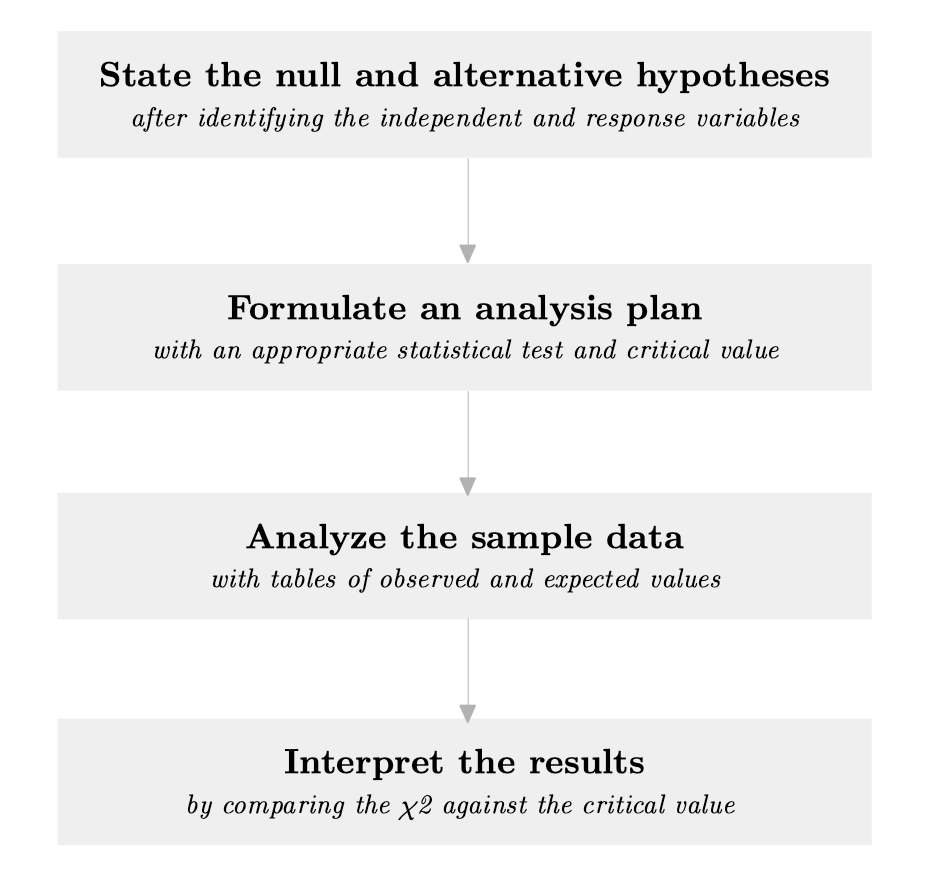
Here is an explanation of each of the steps.
1. State the hypotheses
The first step of planning the experiment is to state the null and alternative hypothesis between the independent and the responding variables of the experiment.
Loosely speaking, the alternative hypothesis is a statement that we have made some discovery while the null hypothesis is a statement that we did not discover something new.
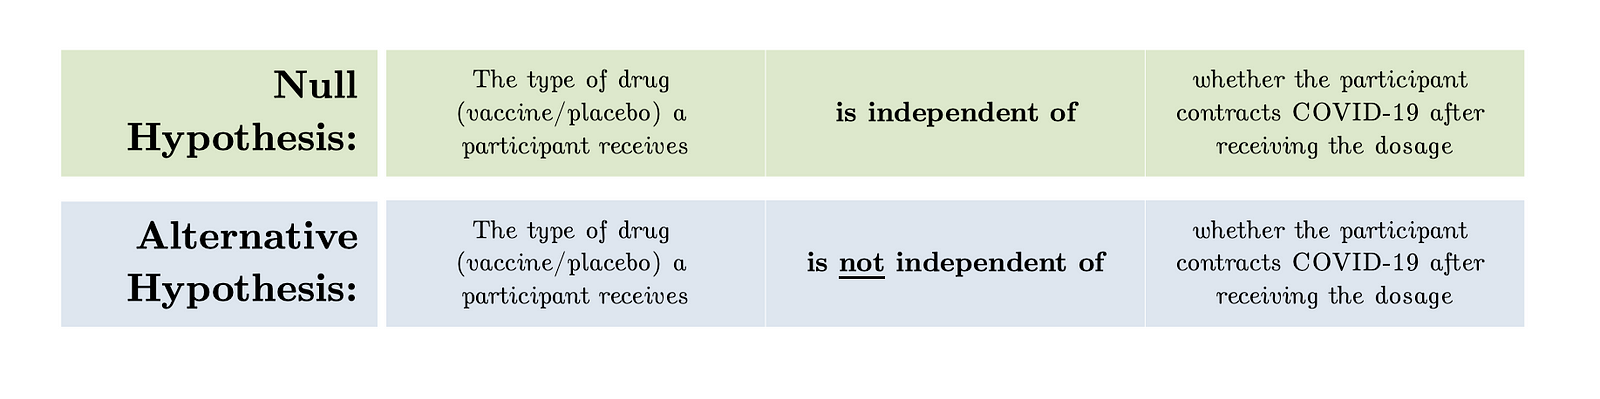
Here are the hypotheses for in the context of a randomized controlled trial.
2. Formulate an Analysis Plan
To decide whether the reject (or not reject) the null hypothesis, we need an analysis plan. In this plan, we need to decide on the level of significance and the statistical test to be used.
Level of significance
The level of significance is the (maximum) probability of rejecting the null hypothesis when it is in fact true. This is known also known as the false negative rate.
The researchers can decide on the level of significance of the statistical test. In randomized clinical trials, a significance level of 5% is usually used.
In this context, we assume that a 5% level of significance is chosen. This tells us that there is a (maximum) 5% probability that we reject the claim that there is no association between the type of drug (vaccine/placebo) given to the participant and whether the participant contracts COVID-19 after receiving the dosage, when in fact there is an association.
Statistical Test
The statistical test is chosen based on the format of the hypothesis and the type of variables. Each test has a test statistic, which simplifies the data set into one number that distinguishes the null hypothesis from the alternative hypothesis.
In the context of a vaccine trial, the test is a chi-squared test of independence, which is used to determine if there is a significant association between two categorical variables. The test statistic is the chi-squared value (χ2). We will calculate this value in the next section.
The larger the value of χ2, the more unlikely is the sample findings, given that the null hypothesis is correct. This in turn indicates a higher probability that the null hypothesis is false. Thus, if the χ2 is larger than a particular threshold, we reject the null hypothesis.
You might be wondering — how do we decide on this threshold?
Critical value
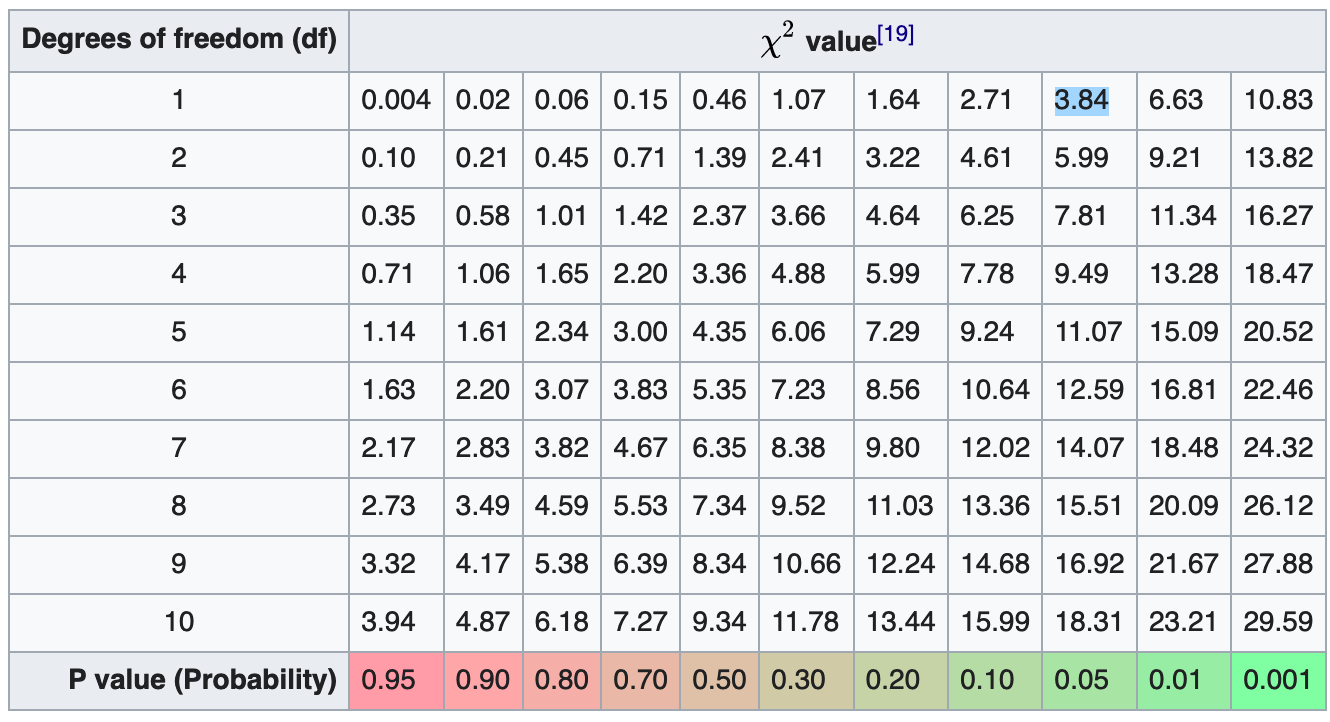
The chi-squared value threshold, or the critical value, is decided by the level of significance and the degree-of-freedom of the chi-squared test. In this context, we are running a 1-degree-of-freedom chi-squared test with 5% level of significance.
We can consult the table of critical values of chi-squared test at various levels of significance and degrees of freedom, as highlighted in figure below. Voila, we found that the critical value is 3.84.
3. Analyze the sample data
Now, we have decided on the χ2 threshold to reject the null hypothesis, but we have not calculated the actual χ2 value for this dataset. The logical next step is to find the actual χ2 value of this particular data set.
To compute the chi-squared value, we refer to the formula below.
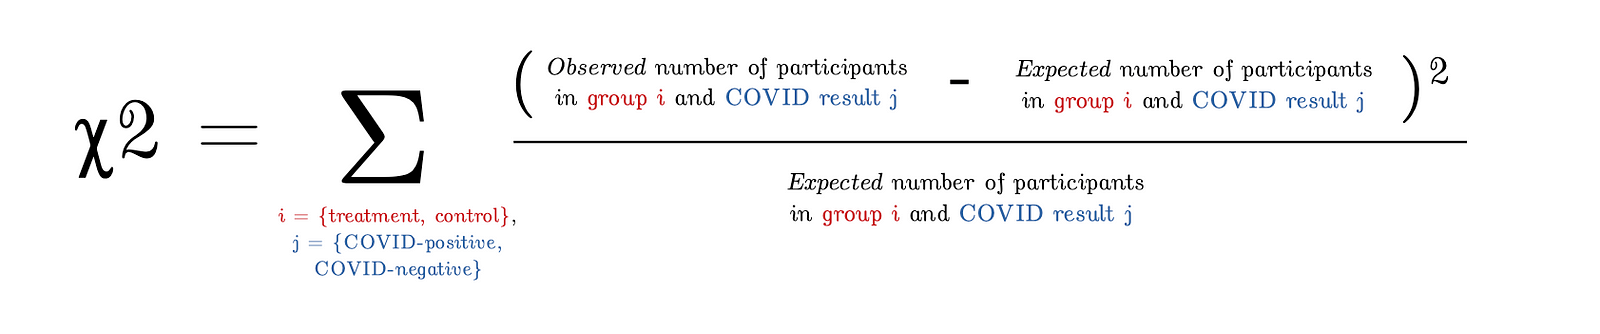
The calculation of actual χ2 of a dataset usually involves three tables — the table of observed value (Table 1), the table of expected value (Table 2), and a derived table from Table 1 and 2. Each of these tables are a 2x2 table.
Table 1: Table of observed values
The table of observed value is simply a table that records down the actual number of participants who tested positive (or negative) for COVID-19 in the control and treatment groups. This is shown as follows:
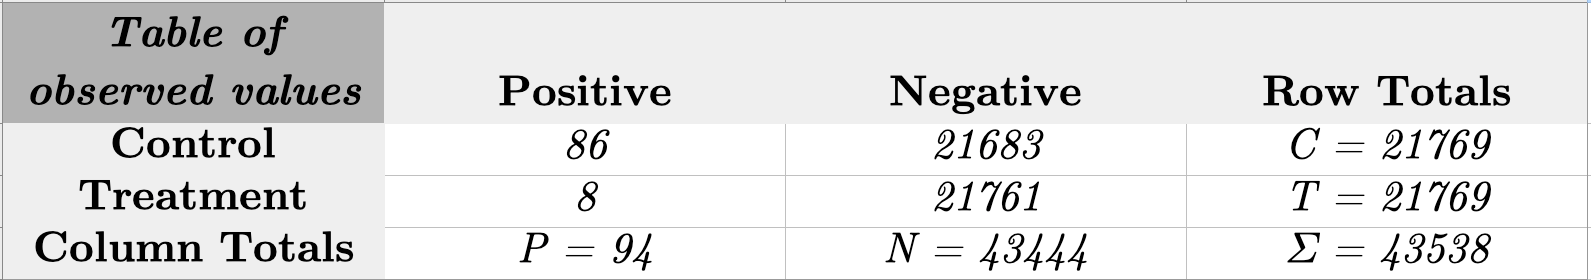
Table 2: Table of expected values
The table of expected value shows the expected number of participants who test positive (or negative) for COVID-19 in the control and treatment groups if the vaccine is not effacacious.
In other words, we expect that the number of COVID-positive and negative cases to be equally distributed among the control and treatment groups, as shown in the table below.
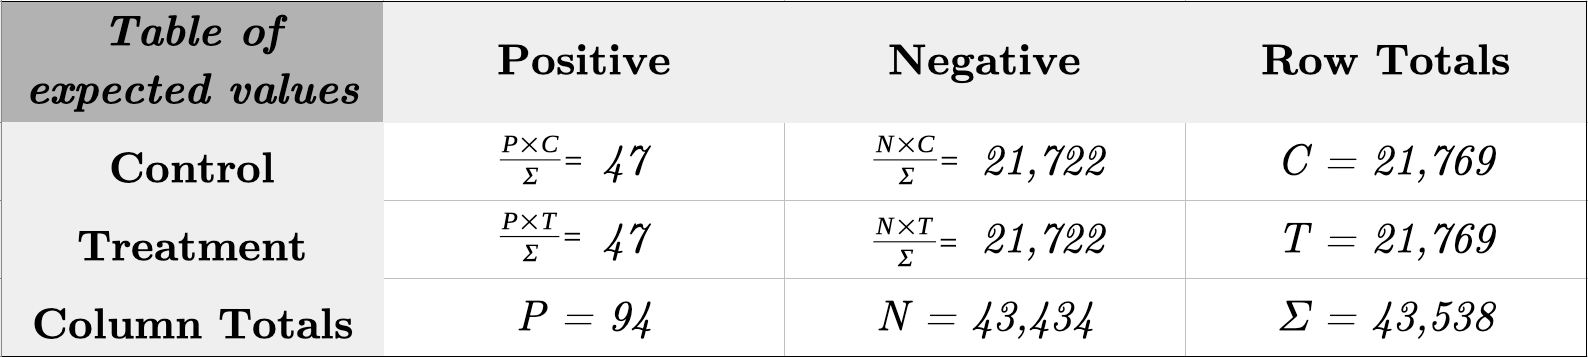
Table 3: Derived Table from Tables 1 and 2
This table calculates the squared difference between the observed and expected value normalized by the expected value, i.e. (Observed value — Expected value)² / (Expected value). The observed values are from Table 1 and the expected values are from Table 2.
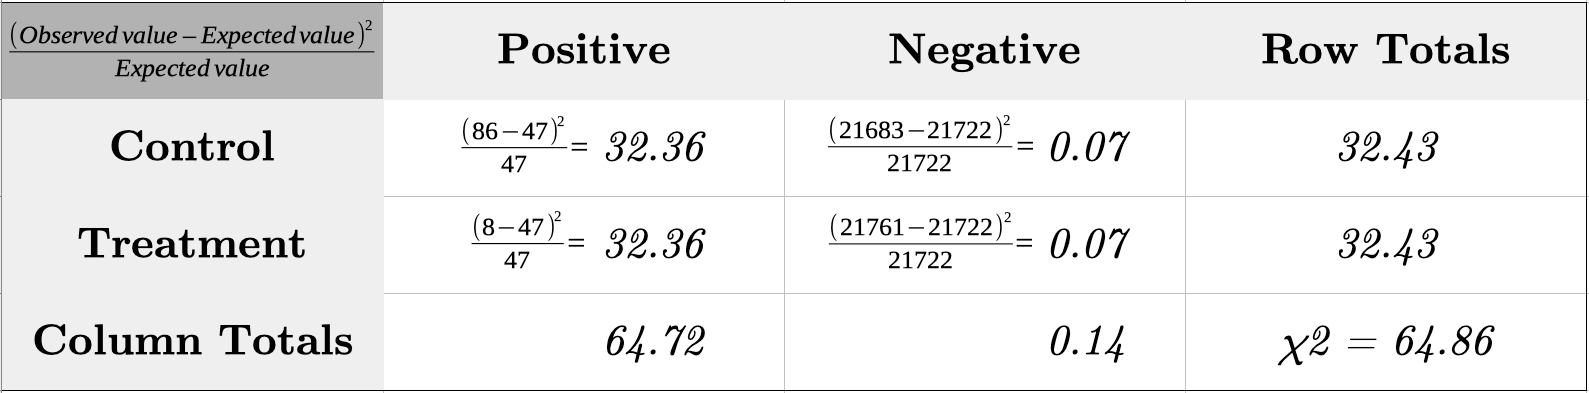
If we sum up all the values in Table 3, we obtain the χ2 = 64.86 (bottom right cell).
4. Interpret the results
In step 2, we found that the critical value is 3.84. Since the chi-squared value of 64.86 is larger than that of the critical value of 3.84 at 5% level of significance, we conclude we should reject the null hypothesis and…
independent of
Incidentally, the chi-squared value of 64.86 is so much larger than the critical value of 3.84 (i.e. at 5% level of significance), indicating an extremely strong evidence in favour of the alternative hypothesis. For those who are familiar with the topic of statistical testing, a 1 degree-of-freedom chi-squared value of 64.86 corresponds to the p-value of close to 0 (to be precise, 8.027e-16).
To answer the question of how confident we are that the drug is efficacious, the answer is — the intermediate results released are very strong evidence for the efficacy of the drug.
So, does that mean that this COVID-19 vaccine will work for me?
The short answer is: it depends. Here are at least three reasons why.
1. We are not sure if we can trust the information presented by Pfizer.
Scientific discoveries are usually published in peer-reviewed papers after experts in the field review the validity of the claims, not in press releases. The fact that Pfizer released these numbers in a press release tells us that the numbers released have not undergone the rigorous peer-review process, which undermines the credibility of the data.
Moreover, some experts in the field have expressed concerns about the incompleteness of the data presented, including the demographic group in the population of interest and the exact strain of the virus tested, making it impossible to fact-check the claims made by Pfizer at this point. [5]
2. The result released on Nov 9 is but an interim analysis.
The complete analysis, which will only be done when 164 participants contracts COVID-19 in the study, may paint a different picture. In fact, this was acknowledged in the Pfizer press release which stated that ‘as the study continues, the final vaccine efficacy percentage may vary.’
As the experiment ticks on after this interim analysis, it remains a possibility that more participants in the treatment group contract COVID-19 than in the control group, compromising our confidence in the vaccine’s efficacy.
3. Efficacious in the lab ≠ effective in the real world
Even if a drug has high efficacy in an ideal lab setting, it does not guarantee that it will be effective in the real world. There are a few conditions that need to be fulfilled before an efficacious drug becomes effective.
According to the paper A Primer on Effectiveness and Efficacy Trials [6], some of these conditions are that ‘[it] must be readily available, providers must identify the target population and recommend the intervention, and patients must accept and adhere to the intervention.’

Conclusion
An effective vaccine has long been touted as the silver bullet to curb the devastating effects of COVID-19. Let’s remain cautiously optimistic for the advent of a readily-available COVID-19 vaccine. Even if this mRNA-based vaccine by Pfizer and BioNTech does not pass the regulations, we still have other vaccine candidates to count on (Johnson & Johnson, Moderna, Pfizer and AstraZeneca have each begun phase III trials on their COVID-19 vaccine candidates.)
For the aspiring data scientists reading this post, congratulations for making it this far! You have now understood what it takes to do conduct an A/B test using the chi-squared test of independence.
If you enjoyed reading this, feel free to check out my other posts.

Also, I love interacting with readers. Feel free to reach out to me via LinkedIn.

References
[1] Houle, Sherilyn. “An introduction to the fundamentals of randomized controlled trials in pharmacy research.” The Canadian journal of hospital pharmacy vol. 68,1 (2015): 28–32. doi:10.4212/cjhp.v68i1.1422
[2] “Pfizer and BioNTech Announce Vaccine Candidate Against COVID-19 Achieved Success in First Interim Analysis from Phase 3 Study.” Pfizer, 8 Nov. 2020. Press release.
[3] Miller, John. “Shot in the Dark: Early COVID-19 Vaccine Efficacy Explained.” Channel News Asia, 13 Nov 2020.
[4] R. A. Fisher and F. Yates, Statistical Tables for Biological Agricultural and Medical Research, 6th ed., Table IV.
[5] Richards, Sarah. “Pfizer vaccine results are promising, but lack of data ‘very concerning,’ experts say”. National Geographic, 10 Nov. 2020.
[6] Singal, Amit G et al. “A primer on effectiveness and efficacy trials.” Clinical and translational gastroenterology vol. 5,1 e45. 2 Jan. 2014, doi:10.1038/ctg.2013.13
Disclaimer: This information is accurate at the point of writing the post to the best of my knowledge.
Note from the author: I am not a health professionals or epidemiologists, and the opinions of this article should not be interpreted as professional advice.