Vaex: Using an Out-of-Core Approach to Process Large Datasets
Faster big-data analysis workflows with Vaex


If you’re a data scientist working with large datasets, you must have run out of memory (OOM) when performing analytics or training machine learning models.
That’s not surprising. The memory available on a desktop or laptop computer can easily exceed large datasets. We are forced to work with only a small subset of data at a time, which can lead to inefficient data analysis.
Worse, performing data analysis on large datasets can take a long time, especially when using complex algorithms and models.
Disclaimer: I am not affiliated with vaex.
Vaex: a data analysis library for large datasets.
Enter vaex. It is a powerful open-source data analysis library for working with large datasets. It speeds up data analysis by working with large datasets that would not fit in memory using an out-of-core approach. This means it only loads the data into memory as needed.

4 key features of vaex
Some of the key features of vaex that make it useful for speeding up data analysis include:
- Fast and efficient handling of large datasets: vaex uses an optimized in-memory data representation and parallelized algorithms. vaex works with huge tabular data, processes 1,000,000,000 rows/second.
- Flexible and interactive data exploration: it allows you to interactively explore data using a variety of built-in visualizations and tools, including scatter plots, histograms, and kernel density estimates.
- Easy-to-use API: vaex has a user-friendly API. The library also integrates well with popular data science tools like pandas, numpy, and matplotlib.
- Scalability: vaex scales to very large datasets and can be used on a single machine or distributed across a cluster of machines.

Getting started with vaex
To use Vaex in your data analysis project, you can simply install it using pip:
pip install vaexOnce Vaex is installed, you can import it into your Python code and perform analytics.
Here is a simple example of how to use Vaex to calculate the mean and standard deviation of a dataset.
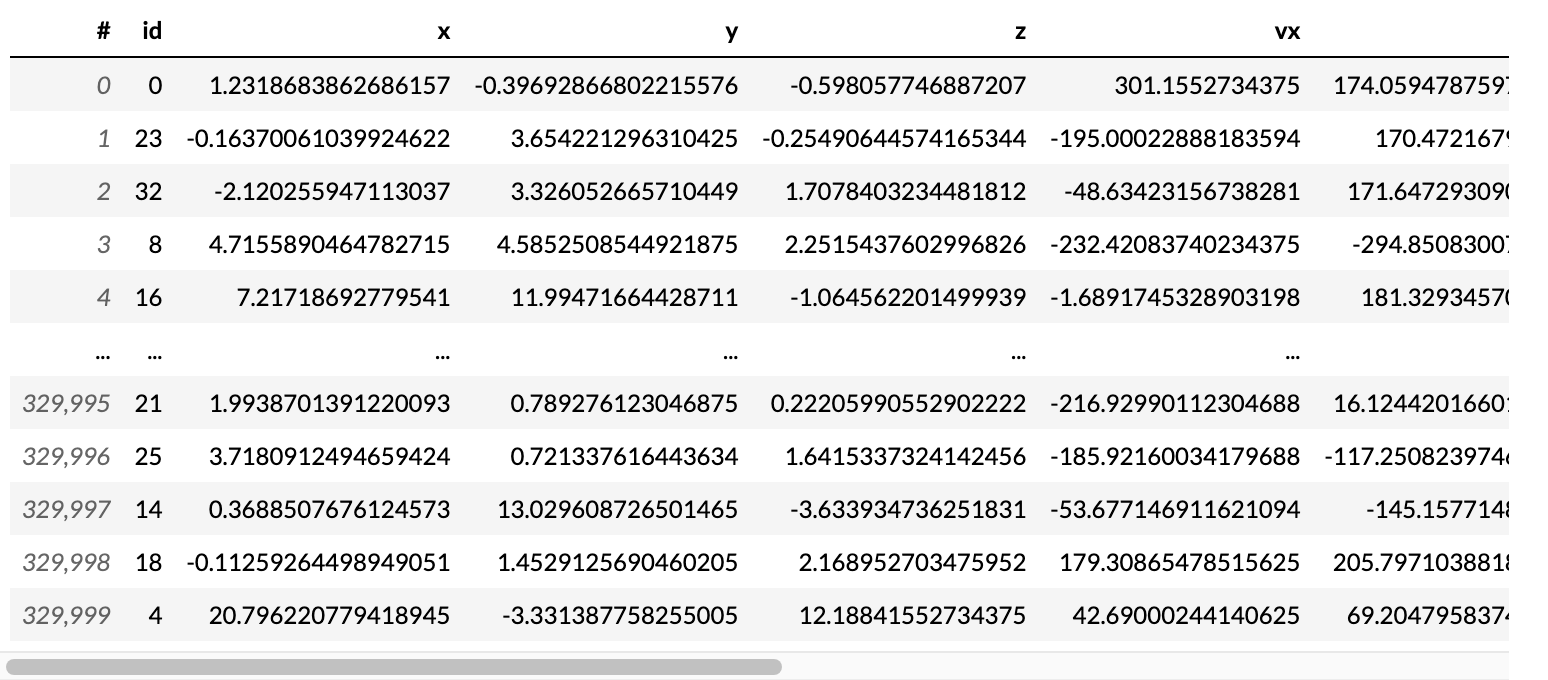
In this example, we use the vaex.open() function to load an example dataframe (screenshot above), and then use the mean() and std() methods to calculate the mean and standard deviation of the dataset.
Vaex syntax is similar to pandas
Filtering with vaex
Many functions in vaex are similar to pandas. For example, for filtering data with vaex, you can use the following.
df_negative = df[df.x < 0]
print(df_negative[['x','y','z','r']])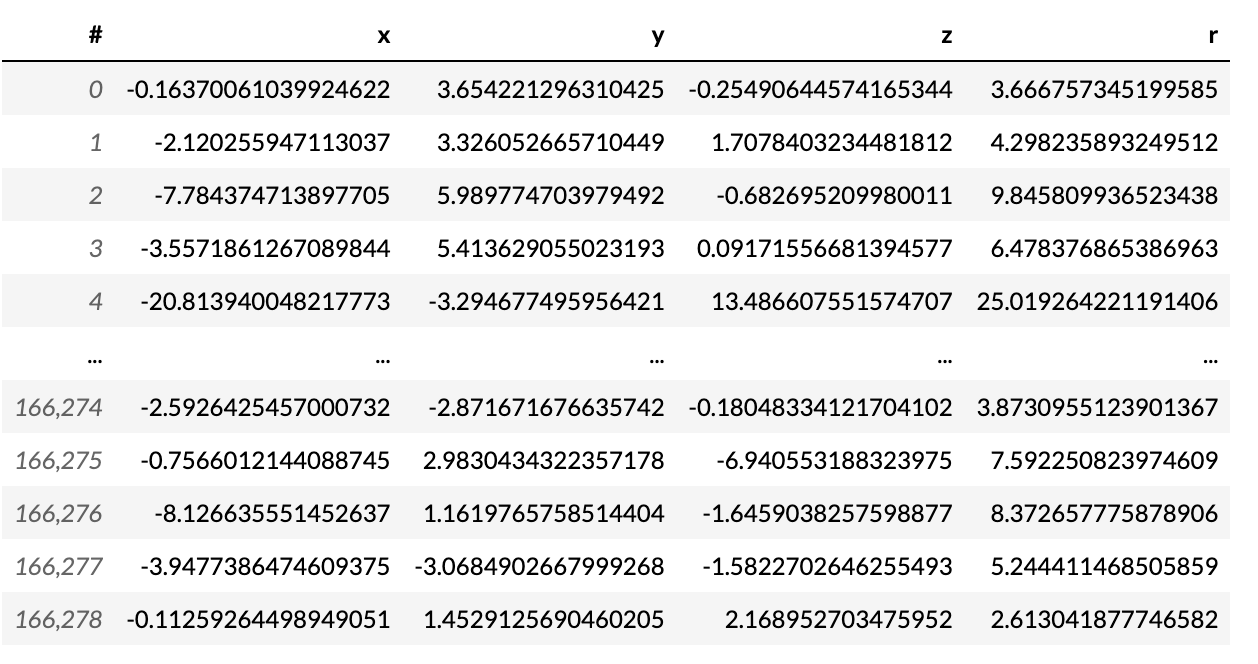
Grouping by with vaex
Aggregating data is essential for any analytics. We can use vaex to perform the same function as we do for pandas.
# Create a categorical column that determines if x is positive or negative
df['x_sign'] = df['x'] > 0

# Create an aggregation based on x_sign to get y's mean and z's min and max.
df.groupby(by='x_sign').agg({'y': 'mean',
                             'z': ['min', 'max']})
Other aggregation, including count, first,std, var, nunique are available.
Performing machine learning with vaex
You can also use vaex to perform machine learning. Its API has very similar structure to that of scikit-learn.
To use that we need to perform pip install.
import vaexWe will illustrate how one can use vaex to predict the survivors of Titanic.

First, need to load the titanic dataset into a vaex dataframe. We will do that using the vaex.open() method, as shown below:
import vaex

# Download the titanic dataframe (MIT License) from https://www.kaggle.com/c/titanic
# Load the titanic dataset into a vaex dataframe
df = vaex.open('titanic.csv')
Once the dataset is loaded into the dataframe, we can then use vaex.mlto train and evaluate a machine learning model that predicts whether or not a passenger survived the titanic disaster. For example, the data scientist could use a random forest classifier to train the model, as shown below.
from vaex.ml.sklearn import Predictor
from sklearn.ensemble import GradientBoostingClassifier

# Download the titanic dataframe (MIT License) from https://www.kaggle.com/c/titanic
# Load the titanic dataset into a vaex dataframe
titanic_df = vaex.open('titanic.csv')

titanic_df = titanic_df.dropna()

# Get numeric columns of titanic_df
features = ['Age','SibSp','Parch','Fare','Pclass']
target = 'Survived'

# Use GradientBoostingClassifier as an example
model = GradientBoostingClassifier(random_state=42)
vaex_model = Predictor(features=features, target=target, model=model, prediction_name='prediction')

vaex_model.fit(df=titanic_df)
Of course, other preprocessing steps and machine learning models (including neural networks!) are available.
Once the model is trained, the data scientist perform prediction using thetransform() method, as shown below:
titanic_df = vaex_model.transform(titanic_df)Let’s print the results. Notice there is a new column “prediction”.
print(titanic_df)
Using vaex to solve the titanic problem is an absolute overkill, but this serves to illustrate that vaex can solve machine learning problems.
Use vaex to supercharge your data science pipelines
Overall, vaex.ml provides is a powerful tool to perform machine learning on large datasets. Its out-of-core approach and optimized algorithms make it possible to train and evaluate machine learning models on datasets that would not fit in memory.
We didn’t cover many of the functions available to vaex. To do that, I strongly encourage you to look at the documentation.
Here is the full code:
import vaex

# load an example dataset
df = vaex.example()
print(df)

# calculate the mean and standard deviation
mean = df.mean(df.x)
std = df.std(df.x)

# print the results
print("mean:", mean)
print("std:", std)

df_negative = df[df.x < 0]
print(df_negative)

# Create a categorical column that determines if x is positive or negative
df['x_sign'] = df['x'] > 0

# Create an aggregation based on x_sign to get y's mean and z's min and max.
df.groupby(by='x_sign').agg({'y': 'mean',
                             'z': ['min', 'max']})

from vaex.ml.sklearn import Predictor
from sklearn.ensemble import GradientBoostingClassifier

# Download the titanic dataframe (MIT License) from https://www.kaggle.com/c/titanic
# Load the titanic dataset into a vaex dataframe
titanic_df = vaex.open('titanic.csv')

titanic_df = titanic_df.dropna()

# Get numeric columns of titanic_df
features = ['Age','SibSp','Parch','Fare','Pclass']
target = 'Survived'

model = GradientBoostingClassifier(random_state=42)
vaex_model = Predictor(features=features, target=target, model=model, prediction_name='prediction')

vaex_model.fit(df=titanic_df)

titanic_df = vaex_model.transform(titanic_df)Follow me for more content.
I am a data scientist working in tech. I share data science tips like this regularly on Medium and LinkedIn. Follow me for more future content.